Instrument Description
The Flare Genesis Experiment (FGE) is a flexible solar observatory. Its capabilities are summarized below.
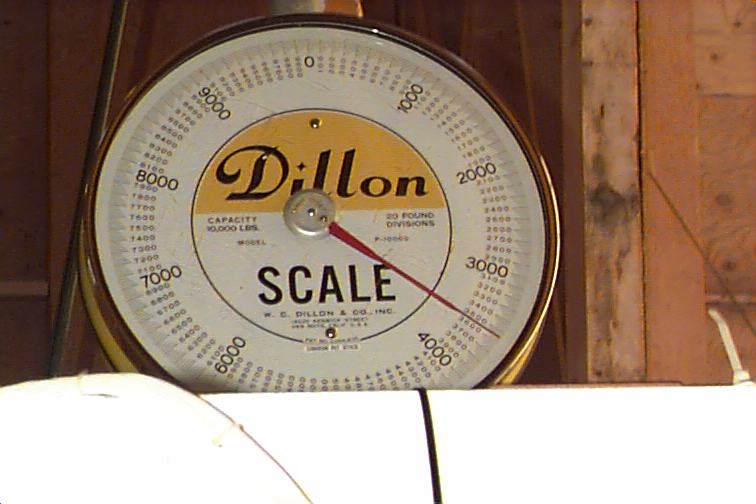
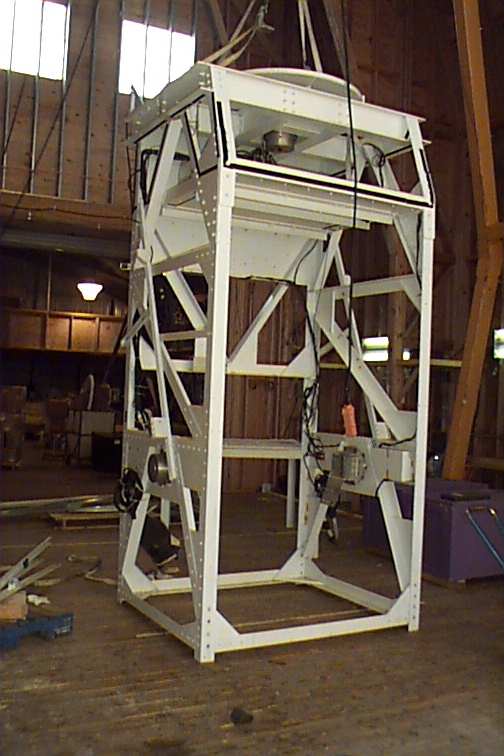
The basic design of the FGE gondola was derived from a payload (Exite instrument) developed by the Harvard/Smithsonian Center for Astrophysics (CFA). The frame is bolted together from standard aluminum angle. This approach was adopted to simplify both material procurement and construction. The structure is strong enough to support the 4400-lb weight of the instrumentation, telescope, NSBF's Support Instrument Package (SIP), ballast and solar panels, even under a design load of 10 g, as well as being rigid enough to allow stable pointing to at least 10 arcsec. CAD drawings of the gondola are below.
FGE Gondola Model
A CAD view of the gondola with the heat-reflecting blankets removed showing the layout of the gondola.
This is a shaded view of the gondola AutoCAD model shown with the main telescope deployed, and viewing the Sun.
Top and side views of the gondola showing the critical dimensions of the scientific payload.
The command and control electronics and the two tape drives are housed in 4 pressure vessels, and with the power system's batteries, reside on the mezzanine level. During flight, thermal blankets protect this area from direct sunlight.
The main telescope (MT), the pointing telescope (PT) , and a pressure vessel housing the optical analysis stages are mounted together and pivoted around the elevation axis, driven by a torque motor.
A key component, at the top of the gondola, is the momentum transfer unit (MTU). The MTU provides (1) the means for pointing in azimuth (a motor provides torque between the frame and a reaction wheel, simultaneously accelerating the frame in one direction and the wheel in the other); (2) a means for transferring momentum from the frame+reaction wheel system into the flight train (a motor provides torque between the frame and the main titanium drive shaft); and (3) the support and attachment point between the gondola and the flight train. One change to CFAs MTU design was the provision of a path through a slip ring and the main shaft for a cable to link the flight train with SIP, required for Antarctic operation.
The FGE telescope was donated by the Strategic Defense Initiative Organization.
Other important FGE components are:
- 50 mm refracting telescope for tracking.
- 1024 x 1534-pixel Kodak Megaplus CCD camera - 20 MByte/s read rate.
- Exabyte tape loaders with 100 GByte capacity.
- 0.16 Å lithium-niobate etalon filter coated for 6000 - 6600 Å operation.
- Six thin-film 1.25 Å prefilters for wavelength selection.
- Two liquid-crystal polarization modulators.
- Lateral effect diode to detect pitch and yaw to ~ 0.3 arcsec.
- Image motion compensation of 0.1 arcsec at the focal plane.
Supporting components:
- Two 6 ft x 12 ft solar panel arrays - 1000 W capacity.
- Reaction wheel and momentum transfer unit for azimuth pointing control.
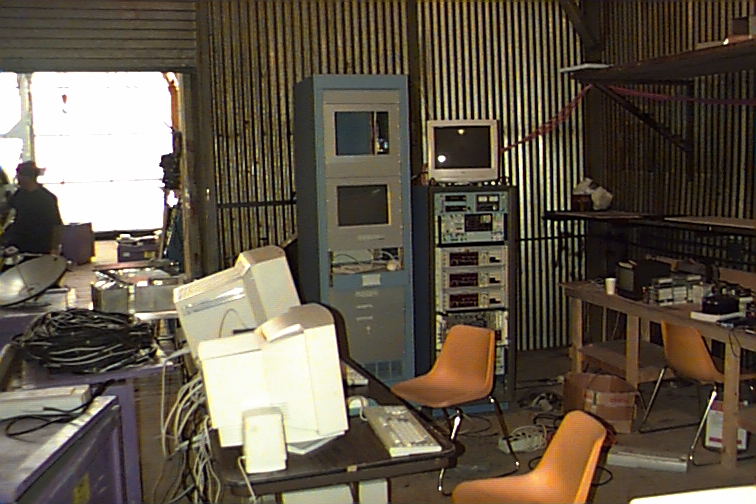
- Ground support computers, recorders and transmitters.
- On-board S-band transmitter - 0.5 Mbits/s (line of sight).
Optical Layout
The key high-technology optical elements are the light-weight, ultra-low-expansion primary mirror, the single-crystal silicon secondary, the graphite-epoxy telescope tube, a tunable lithium-niobate optical filter (Rust 1994), and an image motion compensator based on a novel silicon retina (Strohbehn et al. 1993).
The graphite-epoxy telescope structure provides high thermal stability.
The heat absorbed by the silicon secondary mirror during the first flight was removed with a heat pipe. The secondary never got above 37 C, which is amazing, considering that the intensity of the incident solar radiation on it was 60 times normal. At a pressure of 3 mb, even the most pessimistic models predict no air turbulence until the mirror temperature exceeds 80 C. Indeed, the images show no evidence of "seeing." The heat pipe broke during the landing. For the next flight another method will be used to remove the heat from the secondary mirror: heat conductive ribbons will be attached to the back side of the secondary mount and connected to the heat shields protecting the telescope spider arms. The heat will be absorbed by the heat shields and radiated into space.
The first graphic shows the part of the FGE optics before the beam enters the Optical Pressure Vessel (OPV). This graphic displays the optical setup inside the OPV (the beam enters the OPV from behind, perpendicular to the paper plane), and here the pointing telescope optical layout is shown.
Image of the sun in H-alpha
An image obtained with the Fabry-Perot through the Target Selector Telescope in H\alpha during testing in Albuquerque, NM on July 12, 1995.
Fabry-Perot Etalon
The FGE etalon consists of a 75-mm-diameter wafer of lithium niobate polished to a flatness of about one-hundredth of a wave. When voltage is applied to the indiumtin-oxide coatings on the crystal faces, an electric field is impressed on the etalon cavity that alters the index of refraction of the lithium niobate, which alters the optical path length in direct proportion. Thus, the wavelength passed by the filter is proportional to voltage. On the first flight, the filter had a passband of about 160 mÅ and, in conjunction with the blocking filters, it could be tuned to any of four wavelengths: 6563 Å (Ha), 6122 Å (Ca I), 6302 Å (Fe I), or 6249 Å (continuum).
We are working with the supplier, CSIRO in Australia, to perfect a "universal filter." They have just delivered a new etalon with a full aperture finesse of ~ 27 and a spectral range of 5000 Å to 7000 Å. Such a high finesse translates into a 0.125 Å passband. We will use this filter either singly or in combination with another on the next flight. Two etalons in series yield a 0.1 Å passband. They will require blockers that are ~20 Å bandwidth. The existing 1.5 Å blockers have proven to be quite sensitive to temperature and aging, and the broader filters will solve this problem.
Instrument Capabilities
- Spatial resolution:
- limited by diffraction to 0.2" (140 km at the Sun).
- Spectral resolution:
- 0.016 nm passband tunable over spectral line profiles with repeatability to 1 x 10⁻⁴ nm.
- Wavelength range:
- 610 - 660 nm.
- Field of view:
- 100" x 150".
- Detector:
- charge coupled device (CCD), 1024 x 1534 unocculted pixels.
- Exposure interval:
- 150 s for one vector magnetogram (12 images).
- Data products:
- time series of vector magnetograms at various wavelengths, vector velocity and intensity in the photosphere and chromosphere.
- Data storage capacity:
- 54,000 images = 9 tape cassettes each with 6000 images
- Telemetry downlink:
- 0.5 Mbit/s images for target selection, 1 kbit/s for commands and status checks
- Detectable magnetic field:
- Bz = 1 - 10 G, Bx,y = 50 - 100 G, (depends on tradeoffs in data processing) Bz is the line-of-sight component.
- Velocity sensitivity:
- ~ 5 m/s
- Intensity sensitivity:
- FI/I = 4 x 10⁻⁴ single pixel, 10-3 pixel-to-pixel
- Spectral lines:
-
- 630.2 nm, g = 2.5 Fe I
- 656.3 nm, g = 1.045 H I (Ha)
- 612.2 nm, g = 1.75 Ca I
- 624.9 nm (continuum)
Power, Command Control & Communications, and Pointing Systems
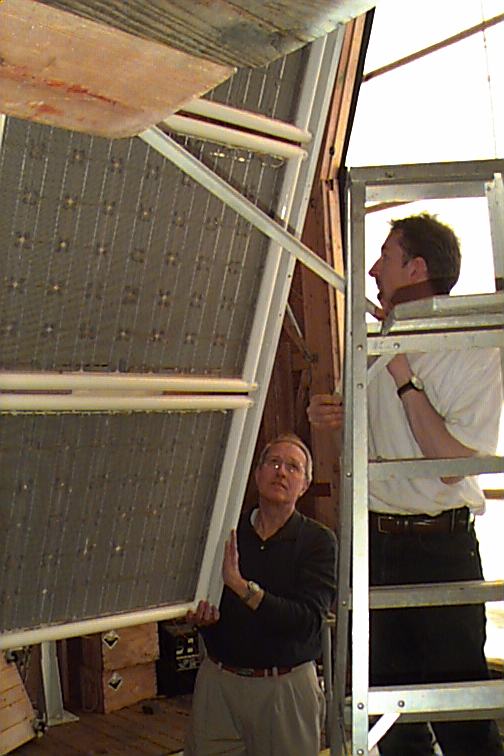
The power system, developed by Meer Instruments of San Diego, consists of four elements: the solar panels, the charge control unit, the voltage regulators, and the battery stacks. There are ten solar panels, five on either side of the gondola. Each panel contains 16 horizontal and 6 vertical rows of 10 times 10 cm mono-crystalline silicon solar cells, joined in series with protective shadowing diodes across every twelve cells. The total active area is 9.6 m2, and with an efficiency of around 12 %, 1.3 kW can be generated at float altitude.
Silicon photovoltaic cells must be operated in a specific manner to achieve peak power production. Setting the operating point is a task performed by the charge controller, which distributes the load across the panels as the power demand changes. The charge controller also ensures that the system's battery stacks are maintained at full charge, sunlight permitting, and it provides on/off switching capability so that the payload can be powered down by a command from the ground, e.g., at the end of the mission.
A set of linear voltage regulators distributes the output from the charge controller to the payload at 31 V over 10 circuits. Inside each pressure vessel, commercial switching regulators provide the voltages required to operate the electronics and actuators.
Three battery stacks are flown, each capable of storing about 1 kW-h of energy. These provide power during periods when the payload cannot be pointed at the Sun, as during the launch-to-float phase, as well as dealing with the short-duration peak currents demanded by the pointing system's torque motors.
Command, Control, and Communications (C3)
An overview of the C3 system is shown in this diagram. The principal component is the Autonomous Control Executive (ACE) computer. It is a 6U VME board manufactured by Motorola with a 68030 microprocessor running a real-time operating system, vxWorks. During development, this machine could be booted via its onboard Ethernet port from a Sun Microsystem Sparcstation II. For flight, the ACE was booted from a Flash ROM disk connected to the onboard SCSI interface. This approach eliminated the need to reprogram a PROM housed inside a pressure vessel anytime an error was detected, and avoided the use of a delicate disk drive.
The primary task of the ACE is to carry out the science mission objectives during the long periods when there may be little or no contact with the ground. Two of the ACE's additional functions are handling the Exabyte tape systems and the CCD camera via an Imaging Technology 150/40 VME framegrabber. There is an Exabyte EXB10i Cartridge Handling Systems associated with an Exabyte 8500C Cartridge Tape Drive. It holds 10 8-mm tapes. The full capacity of the system is about 90 GB.
The adopted CCD camera, a Kodak Megaplus 1.6M, resides in the OPV at the feed from the MT. It has an active area of 1534 columns and 1024 rows, with each pixel being 9 microns by 9 microns and a well depth of approximately 90,000 electrons. When triggered by the IT framegrabber, an exposure in the range of 10 ms to 500 ms is made by opening a blade shutter mounted directly in front of the CCD. Each image is digitized at 10-bit resolution in a separate Camera Control Unit (CCU) located near the camera head. The data is clocked out of the CCU at 10 MHz and delivered to the framegrabber as a 10-bit-wide RS422 differential stream along with separate frame and line synchronization signals. Once captured by the framegrabber, the image is available to the ACE, which can then write it to 8 mm tape or transmit it over the high-speed RF channel via a Mizar I/O board located on the same VME backplane.
The Instrument Control Computer (ICC) provides various services for the ACE, simplifying the interfaces the ACE has to deal with in order to move filter wheels, actuators, temperature controllers and the like. The ICC also handles all communications (except the high speed downlink), collecting and transmitting housekeeping data, handling I/O with the SIP and with all the instrument controllers. In all it deals with nine separate inputs streams and eight output streams, as well as attempting to provide a uniform interface for the ACE to sixteen different devices. The ICC is a Forth-oriented RISC processor (FRISC) developed at JHU/APL. Forth has advantages in instrument development environments such as ours, as it requires only limited host support (to hold a backup of the source), produces compact code, and is readily extensible.
The ICC interfaces to the four instrument controllers, Max1, Max2, Max3, and Max4, via a VMI I/O board. Max1 is a Motorola 68HC11E2 microprocessor which handles the secondary and CCD focus stages as well as the offset pointing motors. Max2 is also a Motorola 68HC11E2 and supplies housekeeping data to the ICC on conditions in the OPV and IMC bench, as well as controlling a wide variety of devices: the positive and negative Fabry-Perot high voltage power supplies, the two liquid-crystal phase-retarder oscillator supplies, the MT beam filter wheels, and the Image Motion Compensation (IMC) system. The IMC is a complex device in itself, and the interface is limited to a few control lines, e.g. "Request Lock."
Max4 is a Microchip PIC16C54 that provides a uniform interface to four temperature controllers: the MT filter wheel, the Fabry-Perot oven, and the liquid-crystal modulator housing. The temperature controllers provide a resolution of 0.01 C and are also based upon a PIC16C54.
The final instrument controller is Max3. This is easily the most complex of the four, having been built up as a special-purpose board designed around a Dallas 87C520 (an upgrade to the 87C51 microprocessor). Max3 collects a large fraction of the housekeeping data for the gondola, including temperatures, pressures, currents, and voltages. It also supplies the control voltages for the servo amplifiers that drive the three torque motors (elevation, reaction wheel, and momentum dump), and the discretes that switch such items as the stow latch. Finally, conversions to and from RS232 for the RF systems are handled on this board.
The most critical function of Max3 is the pointing and control system. In this, Max3 combines input data to determine an "error," and from it and the current state of the payload, produces an output for either the elevation or reaction wheel drives to compensate. Four distinct modes of pointing have been developed:
Track state 0: No tracking. This is the state throughout most of the period from power-up to reaching float altitude. No attempt is made to orient the gondola, so no motors are driven and power consumption is minimized.
Track state 1: Coarse tracking. Four photodiode sensors mounted at 90degree intervals around the gondola provide the position of the Sun in azimuth, while an encoder on the elevation shaft provides that angle. This information is fed to two separate PID (Proportional+Integral+Derivative) control loops, one for azimuth and one for elevation. Pointing accuracy of this loop is only a few degrees, but sufficient to allow hand-off to the next level.
Track State 2: Intermediate Tracking. In this state, a pair of detectors mounted at the front of the pointing telescope bench provide the necessary signals for tracking. Each sensor consists of a cylindrical lens mounted in front of a position-dependent photodiode, one sensitive to the Sun's relative position in azimuth, the other to elevation. With a 10 Hz cadence, these signals are fed to the azimuth and elevation PID loops. Pointing is only to about 0.5 degrees, but it is sufficient to reach the next tracking state.
Track State 3: Fine Tracking. In this critical mode, the error signals are provided by an image of the Sun produced by the PT being formed on a Lateral Effect Diode (LED). The current from each of 4 LED outputs is dependent on both the intensity and the relative distance of the image to the port, allowing the position of the Sun to be estimated accurately (including electronic noise, 5 arcsecs in a 2 degree field of view).
Drawing of the Momentum Transfer Unit (MTU)
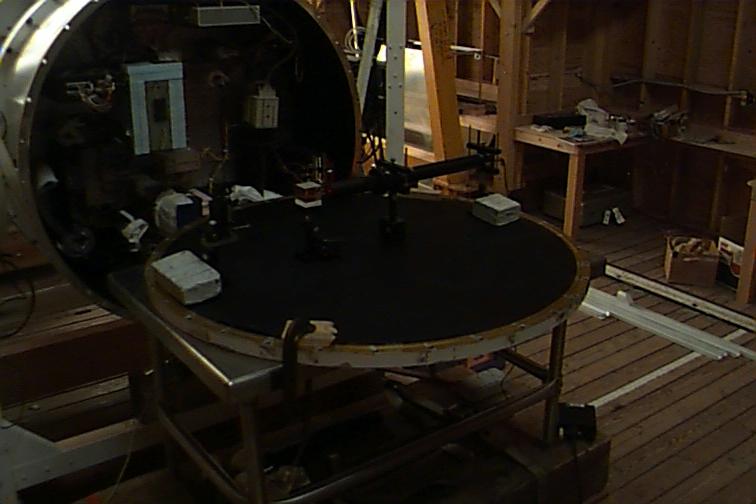
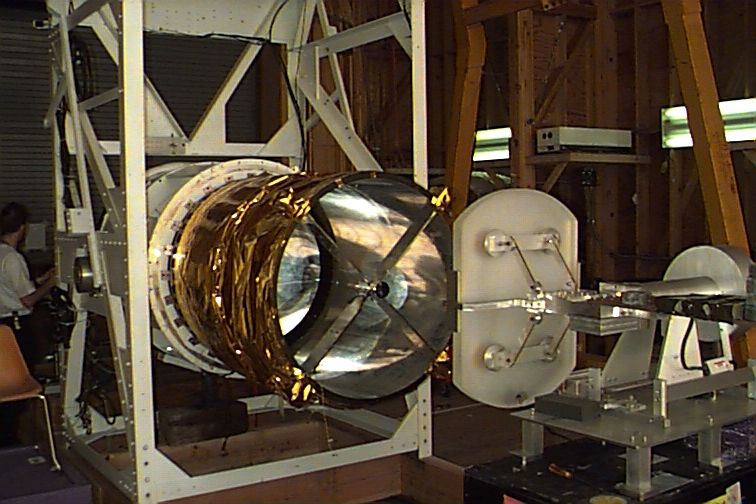
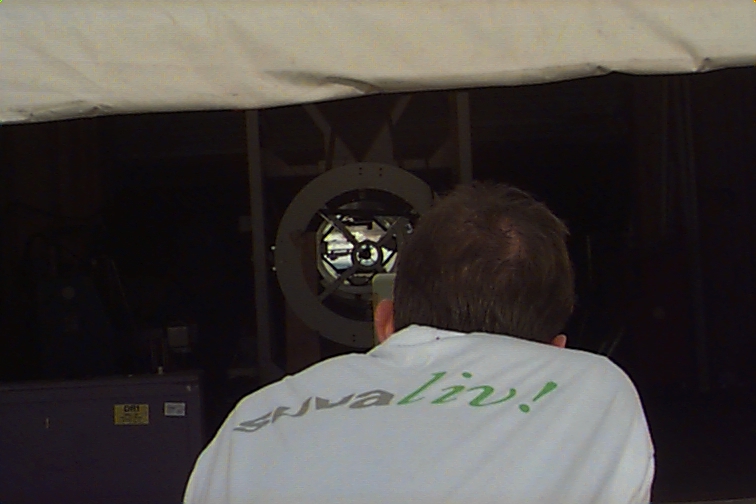
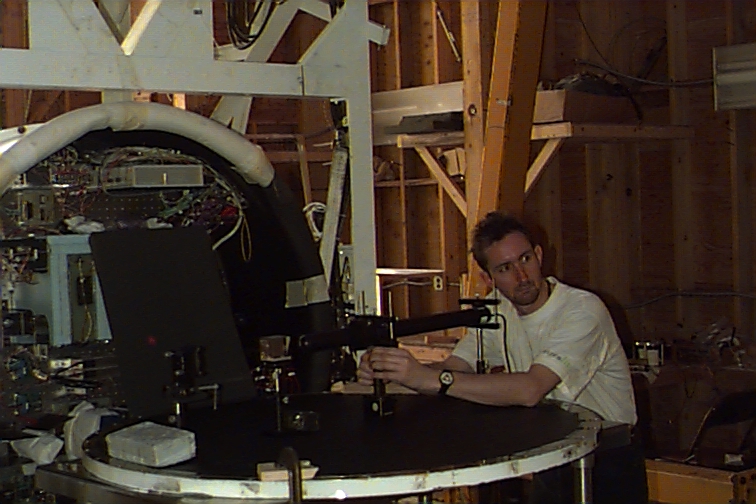
Optical Tests at Kitt Peak (Arizona) in June 1998
During Spring 1998 the FGE telescope has been transported to NOAO/NSO Kitt Peak (Arizona) to perform a series of tests of the optics to estimate its optical quality, and to evaluate the vector polarimeter performances. The McMath-Pierce Solar Telescope of NOAO/NSO was used in the integrated light mode to feed the FGE telescope with a collimated beam of 1.5 m in diameter. In that way we did not have to constantly move the FGE telescope to track the motion of the sun across the sky. This task was performed by the heliostat of the McMath telescope. The following images and magnetograms have been obtained using the FGE 1532 x 1024 CCD camera in its 8 bits resolution mode. Here are optical diagrams of the FGE telescope, and of its post focus optics .
Animated Magnetogram
This image "jumps" between the white light filtergram and the longitudinal magnetogram of a sunspot group observed on June 21 1998 with the FGE telescope installed at NOAO/NSO Kitt Peak (Arizona). The magnetogram has been translated and rotated to match the white light image that was recorded several minutes before. See the Kitt Peak optical tests section for further informations.
-
Image of a sunspot group recorded on June 21 1998. The Fabry-Perot filter bandpass was centered in the core of the CaI 6122.2 line. The exposure time was 100 ms. The black bar on the top left corner is approximately 1 second of arc long (~ 720 km on the Sun), and the field of view is about 150"x100". This image has been flat fielded and Fourier filtered (cut-off high-pass filter). The low contrast in the solar granulation is mainly due to the non optimal seeing (image distortion and blurring due to the Earth's atmospheric turbulence) during the exposure.
-
Image of granulation near the Sun center, also recorded on June 21 1998. The same setup and data processing as for the above image has been used. Details on the order of 1 second of arc or slightly better can be seen in the image.
- Longitudinal magnetogram of a sunspot group recorded on June 21 1998 with the Fabry-Perot passband in the blue wing of the CaI 6122 line. On its right is also shown the Kitt Peak medium resolution magnetogram of the same region, rotated to match the orientation of our magnetogram. The Kitt Peak magnetogram does NOT have the same scale as the FGE magnetogram. White (black) means field lines pointing towards (away from) the observer. The fine black and white pattern visible outside the sunspot and the pores is very likely an artifact due to small differences in the two polarization images produced by the Earth's atmospheric turbulence. The magnetogram is built by computing the normalized difference between the images for the left and the right circular polarization. These two images are recorded with an interval of a few seconds between each other, therefore they are not exactly the same. The Full disk Kitt Peak medium resolution magnetogram (the observed active region is located in the upper right quadrant). An animated magnetogram in which the best white light image recorded on June 21 and the magnetogram are alternatively shown on top of each other.
-
Linear polarization image (Stokes Q) of the same active region
-
Linear polarization image (Stokes U) of the same active region
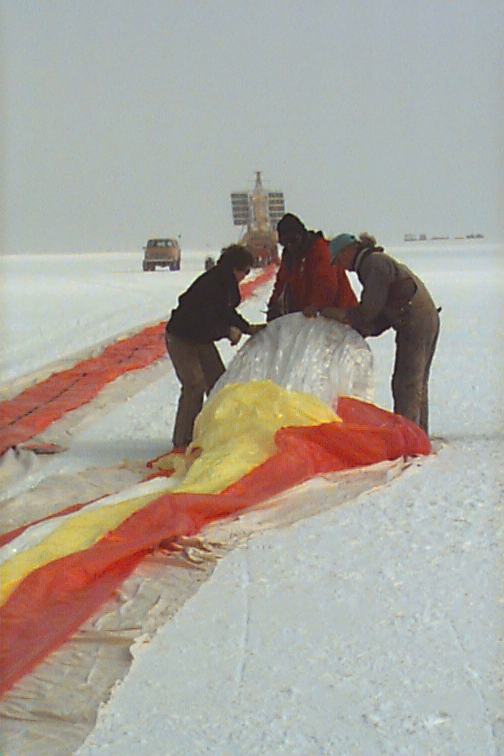
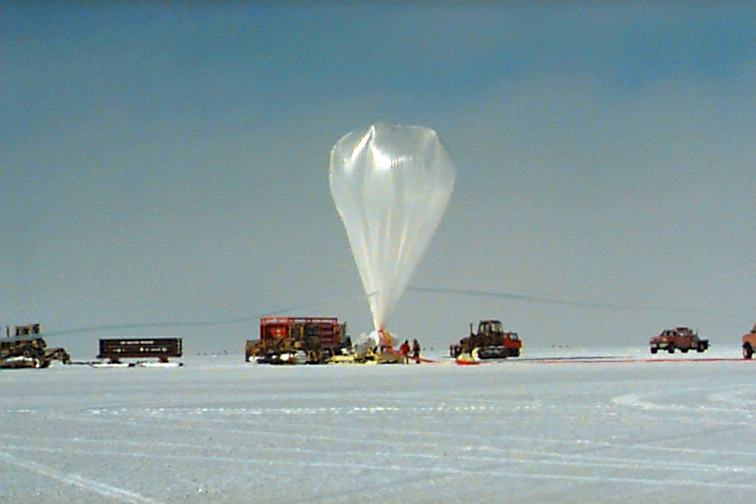
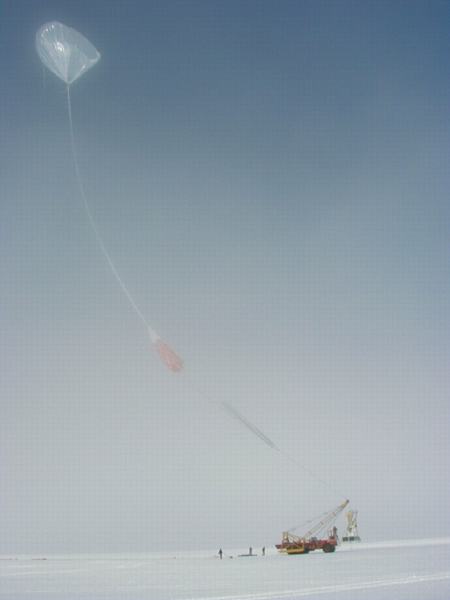
Test Flight in Fort Sumner, New Mexico (January 23, 1994)
To prepare for the Antarctic flight, we conducted an engineering test flight with most of the systems to be flown represented either by the actual full-up system or by part of the system. The test flight took place at the NSBF launch facility near Fort Sumner, New Mexico.
An action-packed QuickTime movie (5MB) of the launch can be viewed with the free QuickTime Player.
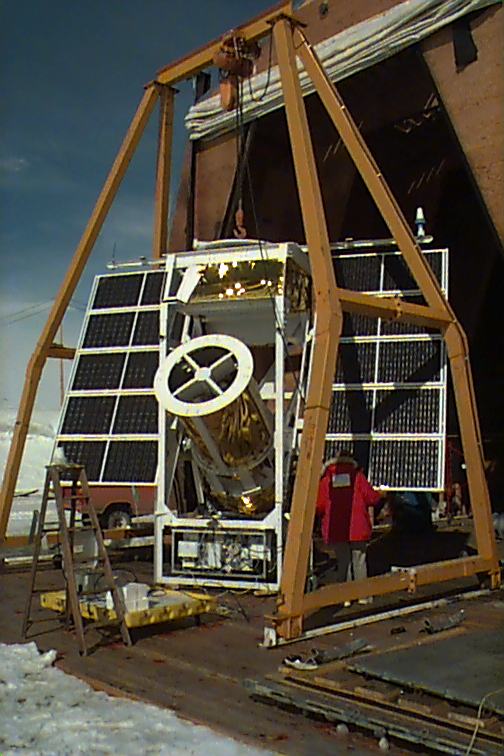
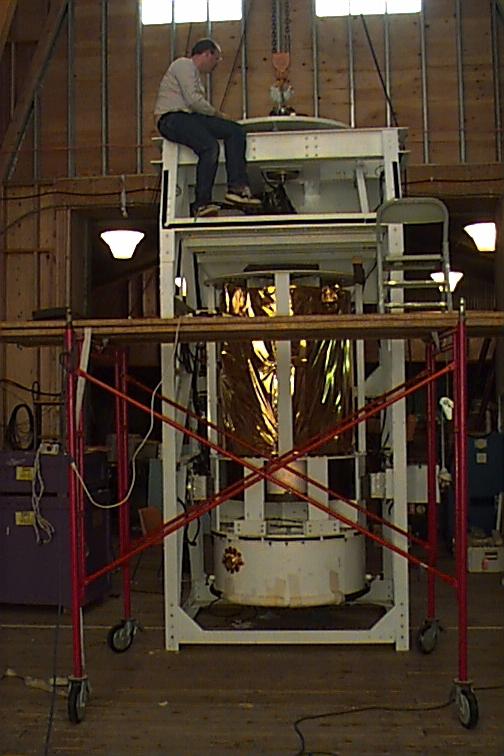
Flight Configuration at Palestine Integration, Texas (August 1995)
Front view of gondola
| 
Left side view of gondola
|
Front view of gondola (telescope deployed)
| 
Right side view of gondola
|
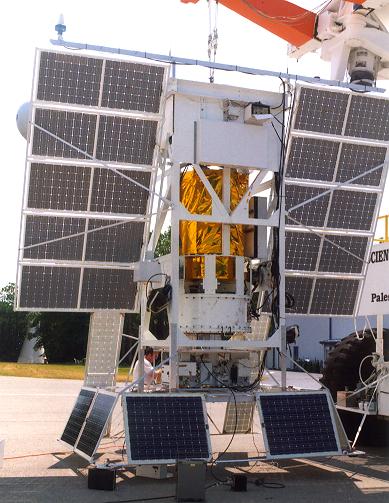
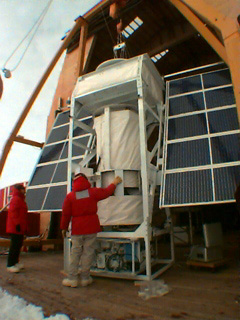
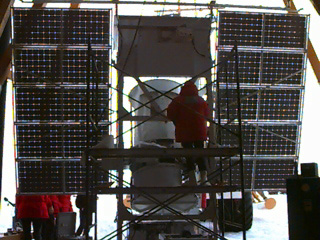
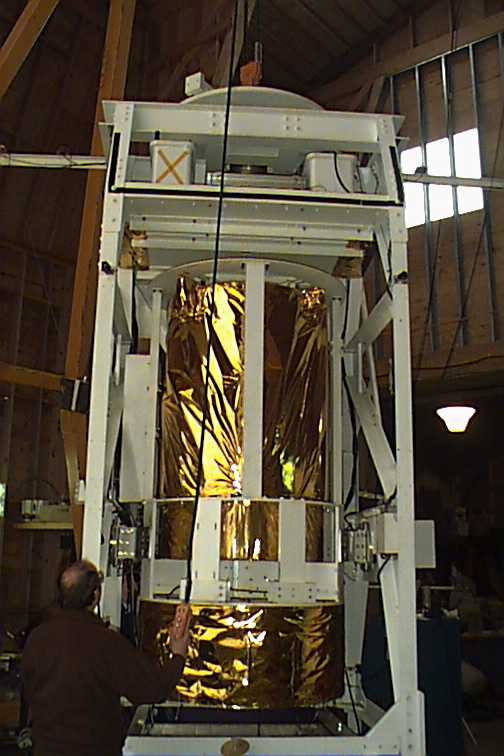
Flight Configuration at Palestine Integration, Texas (August 1999)
Click on images to get a higher resolution version.
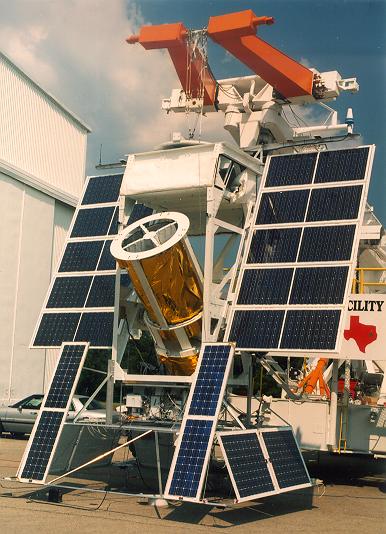
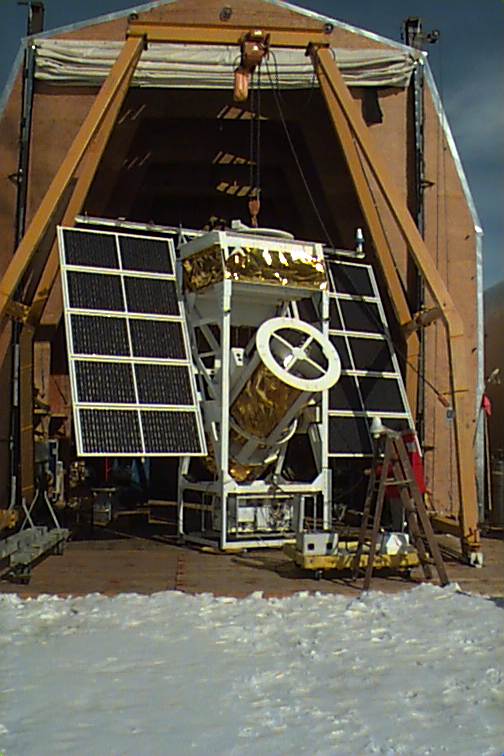
Front view of gondola (Telescope Deployed)
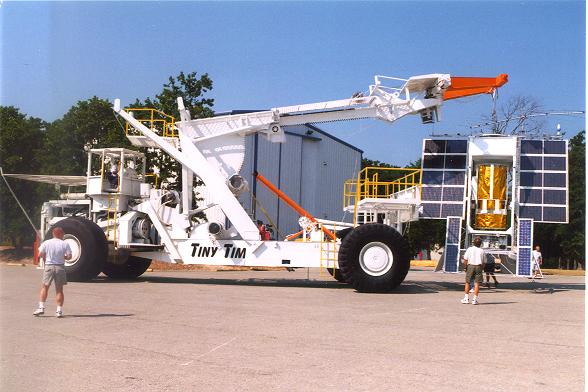
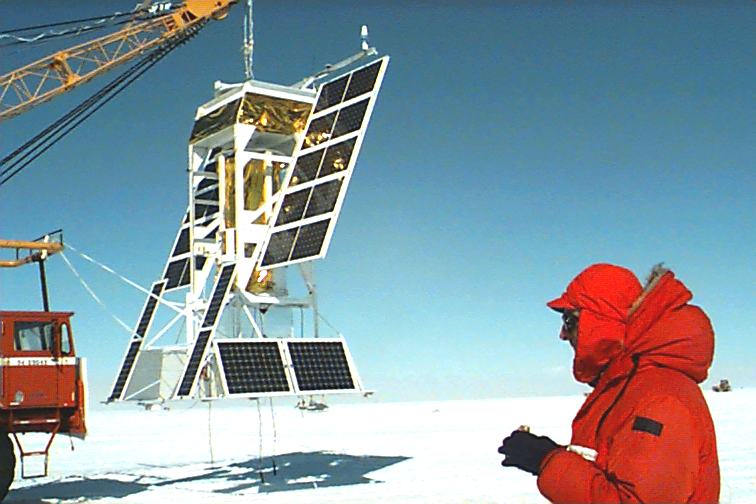
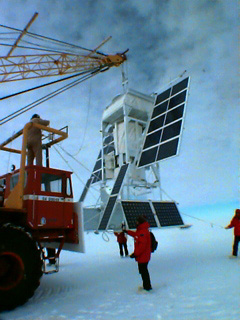
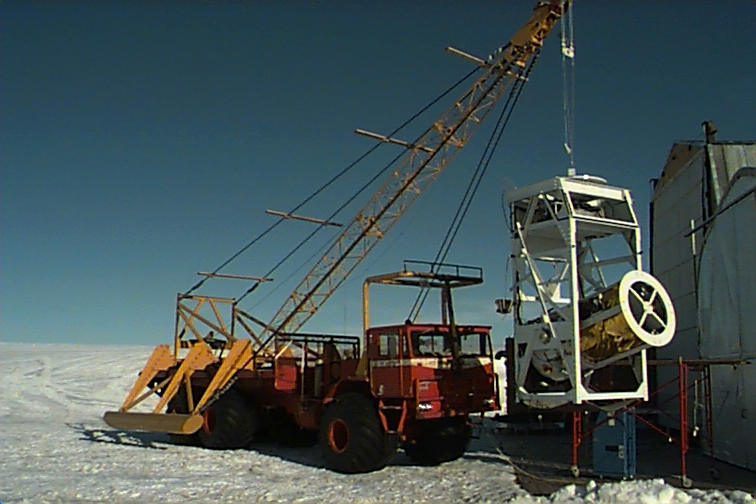
Tiny Tim carying the Gondola
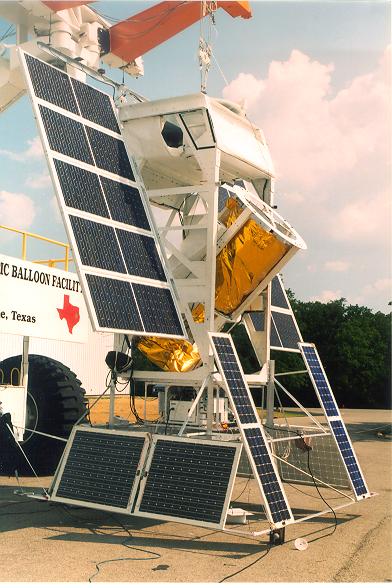
Side view of gondola (Telescope Deployed)
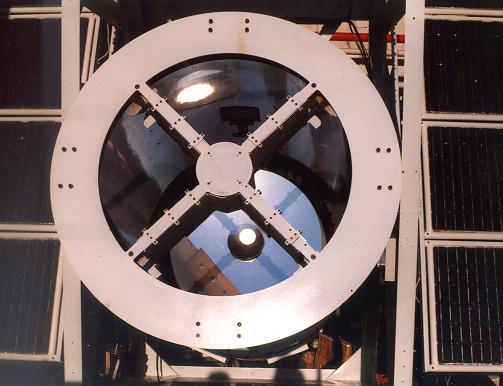
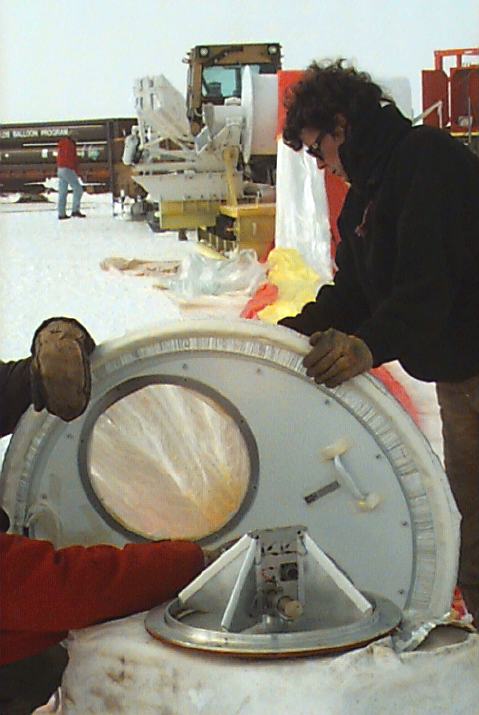
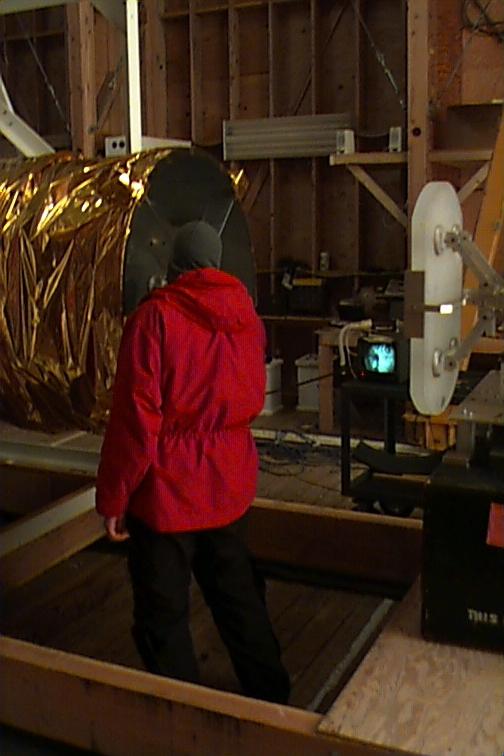
Primary Mirror
Rear view of gondola Telescope Stowed
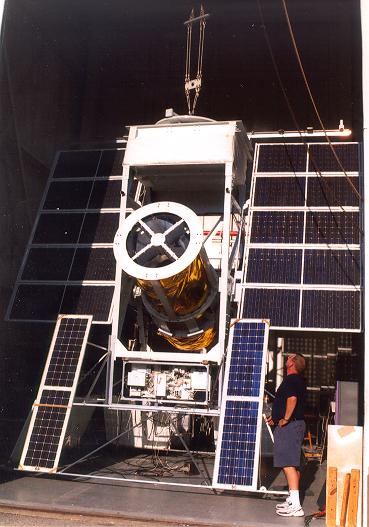
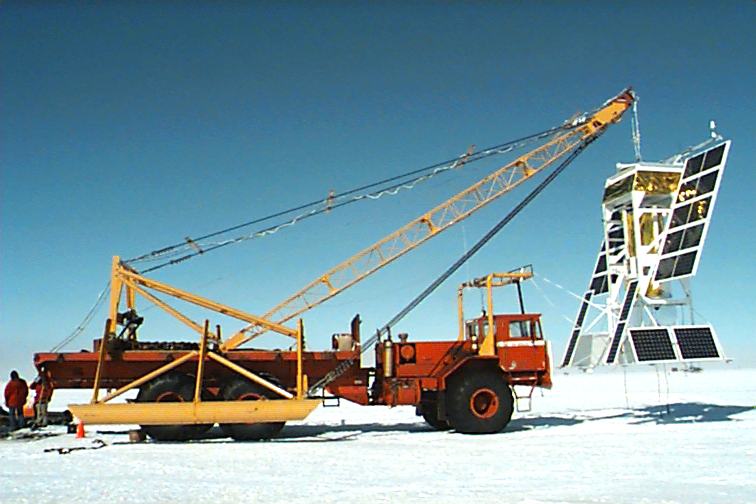
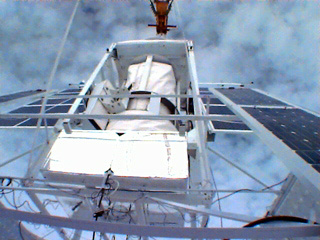
Front view of gonodla in highbay (Hanging from Crane)
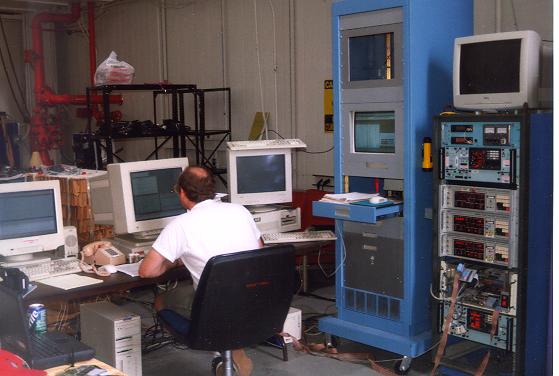
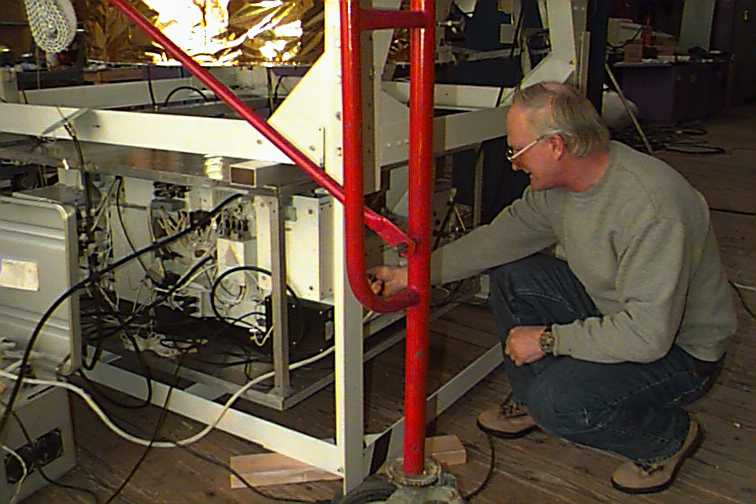
Electronics/Communications Rack
Instrument Bibliography
Bernasconi, P. N., Rust, D. M., Eaton, H. A. C., Murphy, G. A. 2000, A Balloon-Borne Telescope for Hight Resolution Solar Imaging and Polarimetry, in Air-Borne Telescope Systems, R.K. Melugin, H.P. Röser (Eds.), Proc. SPIE 4014, p. 214
Bernasconi, P. N., Rust, D. M., Murphy, G. A., Eaton, H. A. C. 1999, High Resolution Poloarimetry With a Balloon-Borne Telescope: The Flare Genesis Experiment, in High Resolution Solar Physics: Theory, Observations, and techniques, T. Rimmele, K.S. Balasubramaniam, and R.R Radick (Eds.), ASP Conference Series 183, p. 141
Murphy, G. A., Rust, D. M., Strohbehn, K., Keil, S. L., and Keller, C. U. 1996, Flare Genesis Experiment, in Missions to the Sun, D. M. Rust (ed.), SPIE Conf. Proc. 2804, pp. 141-152.
Rust, D. M., Murphy, G. A., Strohbehn, K., and Keller, C. 1996, Balloon-borne Polarimetry, Solar Phys. 164, 403.
Rust, D. M. 1998, Balloonborne Solar Telescope Circles Antarctica in 19 Days, Antarctic Journal of the U.S., Vol. 31, No. 2, p. 1996 Review Issue.
Rust, D. M. 1994, Etalon Filters, Optical Eng. 33, 3342.
Strohbehn, K., Rust, D. M., and Kluga, B. 1994, A Fast, Wide Dynamic Range, Low Voltage Tip/Tilt Mirror, in Acquisition, Tracking and Pointing VIII, SPIE Conference Proceedings 2221, M. K. Masten, L. A. Stockum, M. M. Birnbaum, and G. E. Sevaston (eds.), p. 414.
Strohbehn, K., Andreou, A. G., Jenkins, R. E., and Rust, D. M., A Biologically-Inspired Image Position Sensor, in Real-Time and Post-Facto Solar Image Correction, Proc. 13th Natl. Solar Obs. Summer Workshop, R. Radick (ed.), Natl. Solar Obs., 32 - 43, 1993.
Rust, D. M. and J. W. O'Byrne, A low-polarization solar vector magnetograph, Proc. SPIE, Polarization Considerations for Optical Systems II, San Diego, CA, 368, 1989.
Strohbehn, K., Andreou, A. G., Jenkins, R. E., and Rust, D. M. 1993, A Biologically-Inspired Image Position Sensor, in Real-Time and Post-Facto Solar Image Correction, R. Radick (ed.), Natl. Solar Obs.
Rust, D. M., J. W. O'Byrne, and T. J. Harris, An optical instrument for measuring solar magnetism, APL Tech. Dig., 9, 4, 349-359, 1988.
Burton, C. H., A. J. Leistner, and D. M. Rust, Electrooptic Fabry-Perot filter: Development for the study of solar oscillations, Applied Optics, 26, 13, 2637-2642, 1987.
Rust, D. M., C. H. Burton, and A. J. Leistner, A solid tunable, Fabry-Perot etalon for solar seismology, Proc. Instrumentation in Astronomy VI, SPIE , 627, 39-49, 1986.
Rust, D. M., Hayes, J. R., Lohr, D. A., Murphy, G. A., and Strohbehn, K. 1993, The Flare Genesis Experiment: Studying the Sun from the Stratosphere, Johns Hopkins APL Tech. Digest 14, 358.
Rust, D. M., Some design considerations for a satellite-borne magnetograph, in Workshop on Measurements of Solar Vector Magnetic Fields, edited by M.J. Hagyard, 141-152, NASA Conference Pub., 1985.
Rust, D. M., New materials applications in solar spectral analysis, Aust. J. Phys., 38, 781-790, 1985.


 ) and transversal (
 ) to the line of sight (LOS) were calculated following Ronan et al. (1987):
 ,
, ,
,

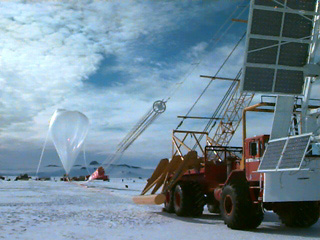
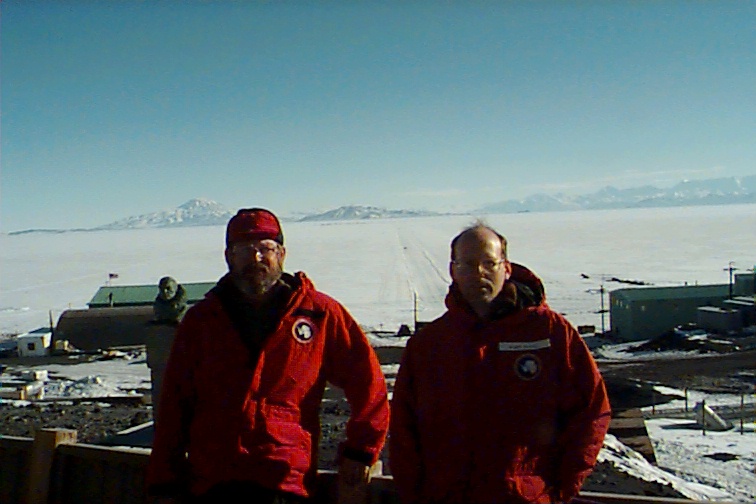
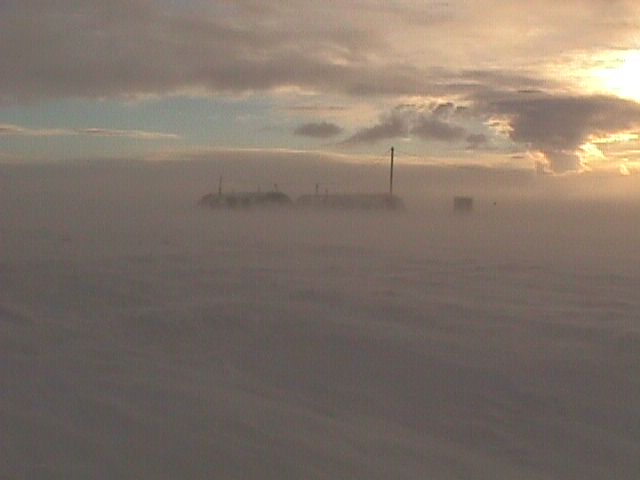
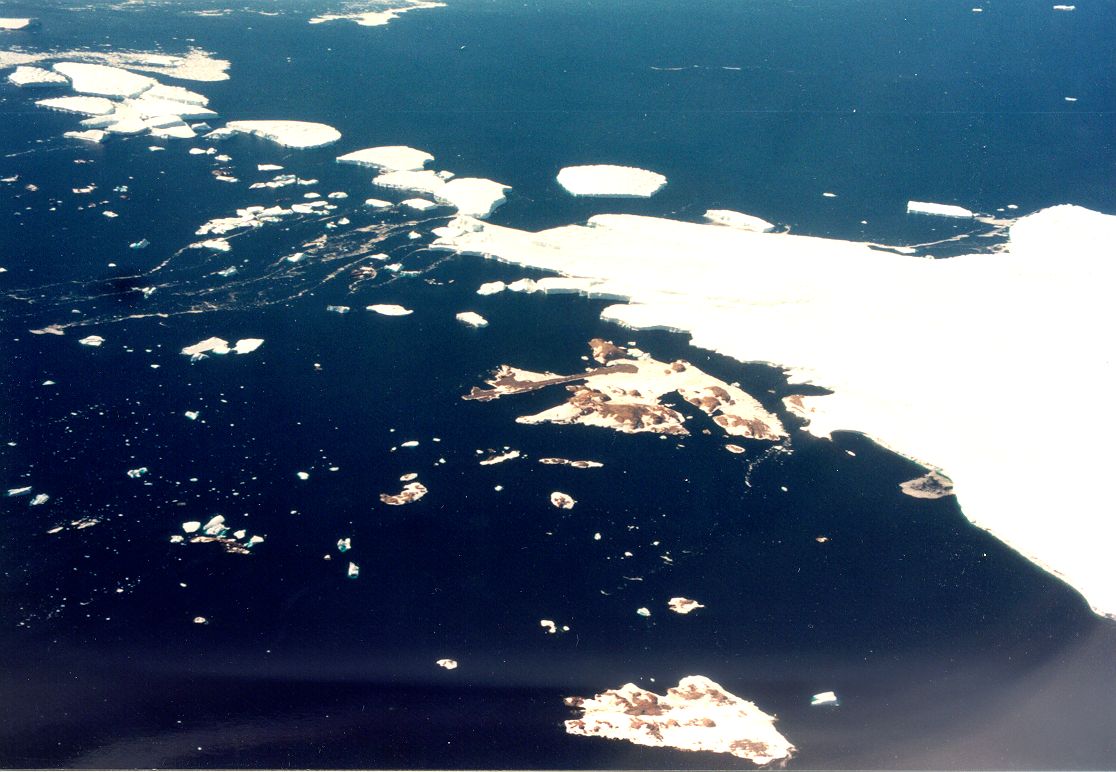
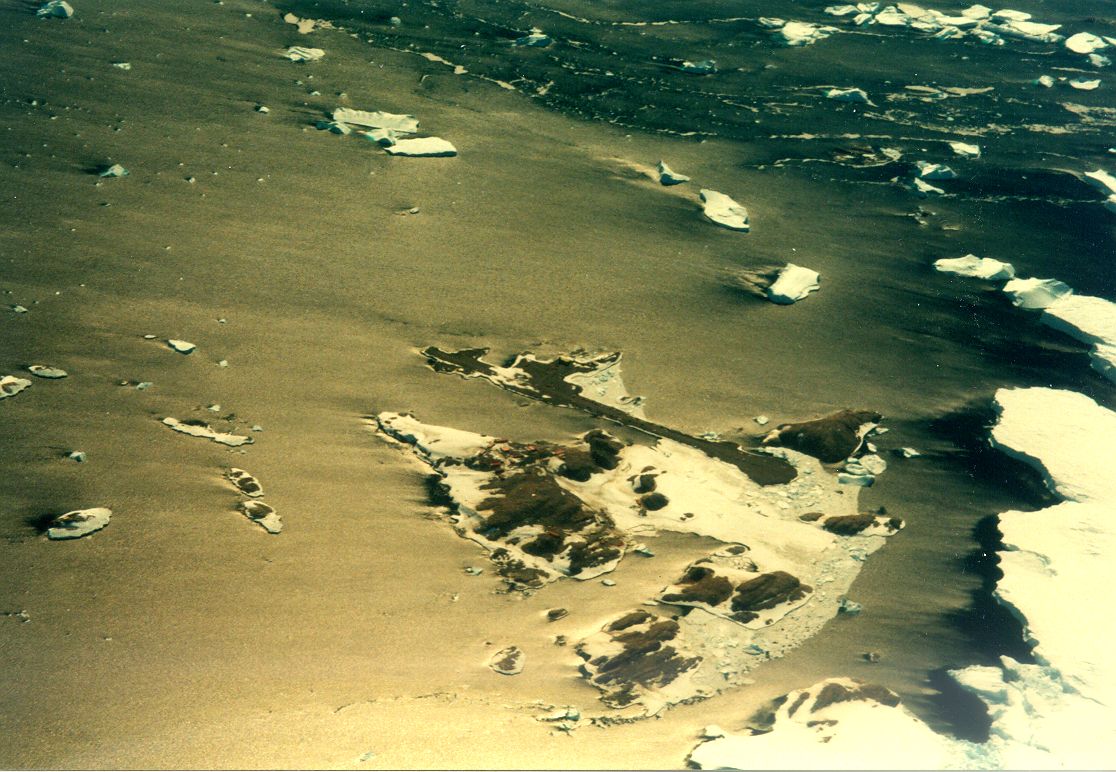
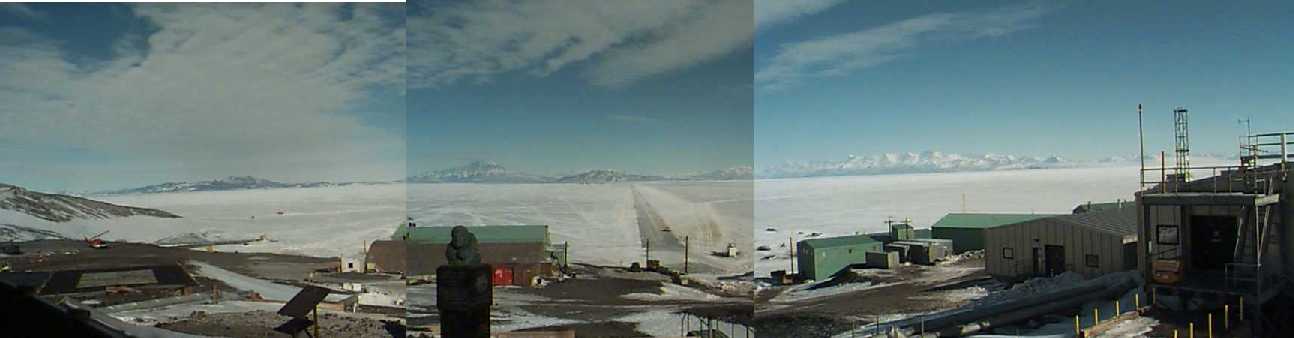 Antarctic Panorama
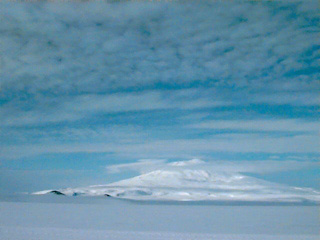
 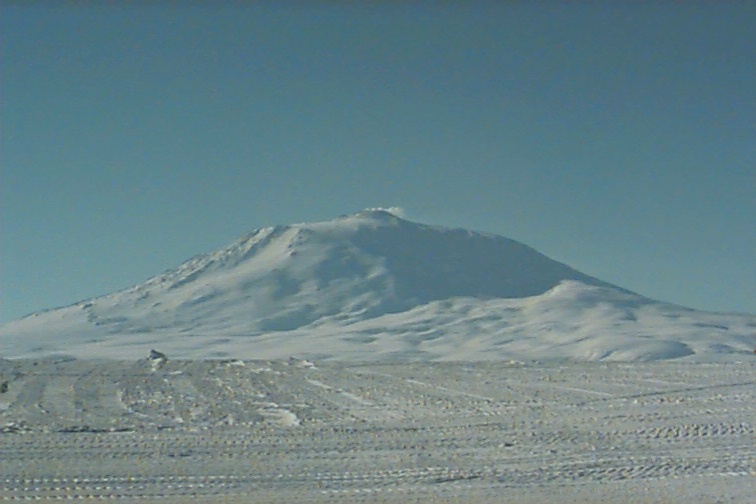 Mt. Erebus
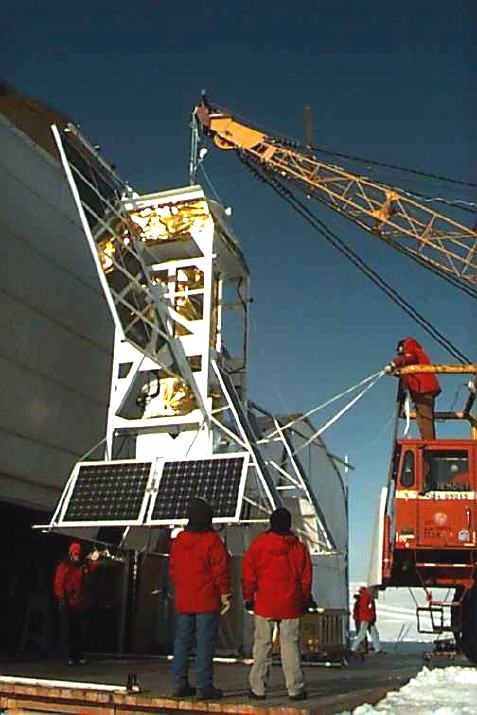


.jpg)


 I'll have to rewrite this page soon - if nothing else, the tense must now be changed from future to past! Hopefully, I'll hear from Harry as to exactly what happened, so I can replace all my speculation with fact!
